

TerraQuest News
- May 2021
Planning Portal MIR Report - Stats from the report
For the first time this year, we have seen application numbers take a dip following March’s bumper month. The Planning Portal saw 65,357 applications submitted throughout April this year showing the trend of 2021 to be following the previous five years, albeit at a higher rate of submission.
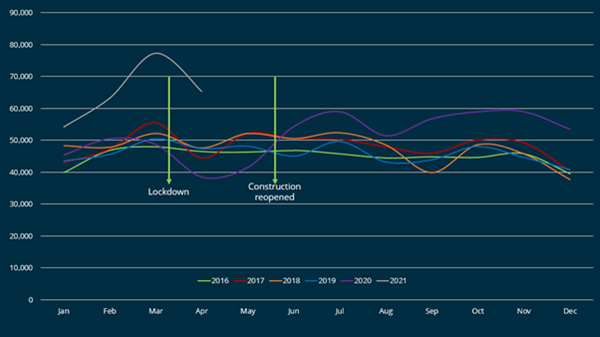
The national graph represents the number of online planning application submissions via the Planning Portal each month since 2016.
After a few bumper months and the excellent recovery we have seen since the initial lockdown, April was the first month to show a drop in the number of applications submitted. While the data indicates an overall higher number of applications submitted throughout 2021, as shown in the above graph, April 2021 has followed previous seasonal trends in that it regularly receives lower application numbers than March. A total of 65,357 applications were submitted throughout April. As the green arrow above shows, April 2020 was the first full month the UK was in lockdown. The precarious position the country found itself in quite rightly caused development plans to be put on hold with only 38,541 applications submitted in April 2020, 19% lower than the previous year. A year on from this point, this number has increased by 70%, showing the bounce back to a much higher than usual level.
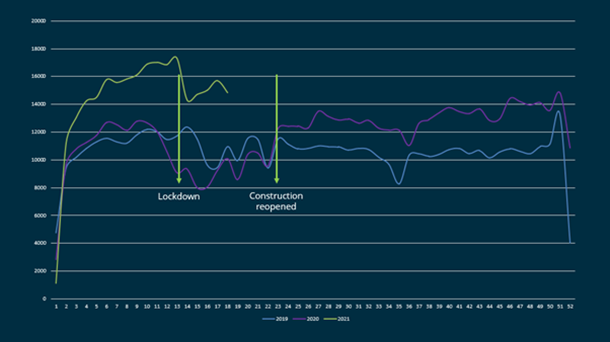
When reviewing the seasonal trends, we must consider that this year the Easter bank holiday fell in early April, reducing the number of working days in the month. To understand the scale of the increase, we reviewed the daily submissions per working day. April 2021 averaged 2,739 per day compared to April 2020’s average of 1,634; this is an increase of over 1,000 submissions daily, which equates to a 68% rise.
Regional
When comparing regional application submissions to the previous month (March 2021), it appears that there has been a reduction across the board. However, none of these figures show more than a 19% decrease, and you must bear in mind the fact April has a reduced number of working days due to the Easter holidays.
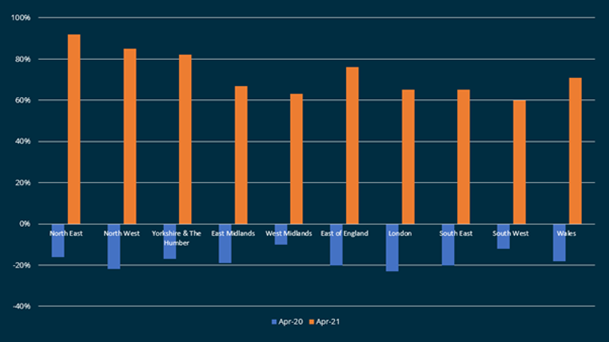
If you compare April 2021’s figures to April 2020 however, the difference is significant. The North regions have seen large increases in application figures. The North East has seen the most notable difference, with a 92% increase on 2020, and a 61% increase on 2019. Up until April 2021, the North East region has shown increases in the number of applications submitted month on month which helps to explain how there is such a leap between 2019 and 2021’s figures. The North West follows at a close second, with an 85% increase when compared to April 2020.
The South West, which has been in the news a lot recently for its frantic housing market and development plans, has seen the lowest increase when compared to April 2020, with 60%. Over the last few years, the South West has seen a consistent level of applications submitted of all application types, indicating that work on extensions and new builds etc have occurred recently. This may explain why we have not seen such a spike in numbers as we have seen in many other regions following the pandemic.
The bar chart demonstrates the percentage difference between the previous year volumes for each English region and in Wales between April 2020 and April 2021.
There will be a regional map to include that compares March 2021 to April 2021 but I need Kirsty to design it. It will basically say that compared to last month that it has seen a drop, something about seasonal trends mentioned above and it will be interesting to see what the coming months do.
The South East of England region includes 73 Local Authorities in the counties of Berkshire, Buckinghamshire, Hampshire, Kent, Oxfordshire, Surrey, East and West Sussex. Statistics from 2019 show it is the region with the highest population at approximately 9.18 million people, followed by the London region with around 8.96 million people.
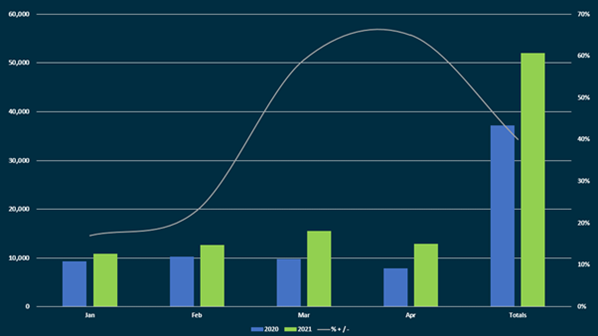
On looking at regional application submissions in 2021, the South East has received the most with 52,020 applications and is followed closely by London with 48,121. Comparing this to the same period in 2020, where a total of 37,206 submissions were received, the South East has seen a 40% increase or an additional 14,814 applications. This influx of applications is creating Local Planning Authority backlogs as they are processing more applications, but with the same levels of resource. That said, most applicants and agents are sympathetic to these unusual circumstances, understand the pressures Local Authority staff are working under and appreciate their commitment to the cause.
It is not surprising to see Buckinghamshire Council at the top as the largest LPA within the region. It is a very new unitary authority, created in April 2020, from the merger of the former districts of South Bucks, Chiltern, Wycombe and Aylesbury Vale. It has averaged over 1,000 applications per month in 2021, up a whopping 36% on 2020! Brighton & Hove City Council are next on the list, receiving much fewer applications but realising a larger overall percentage increase of 40%.
The above article was provided to us by the Planning Portal.
Find out more about the MIR Report here.
