

TerraQuest News
- Apr 2021
Planning Market Insight Report: Online planning application submissions via the Planning Portal each month since 2016.
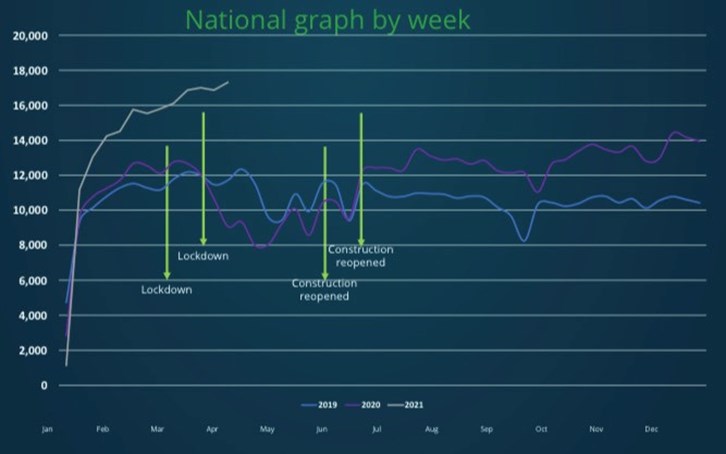
National graph over five years.
Application numbers in England and Wales.
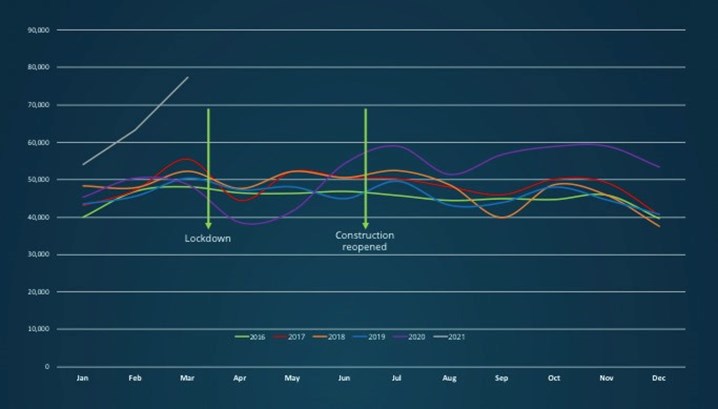
The national graph represents the number of online planning application submissions via the Planning Portal each month since 2016.
Of course, last March was a far from typical month – applications started strongly as usual, but plummeted once lockdown was announced, meaning that the overall total for the month was lower than we would normally expect. By contrast, this March has seen the highest number of applications ever submitted online in a single month, continuing the pattern of the last 6 months and continuing the strong start for 2021.
Total application submission in March 2021 reached a whopping 77,289 applications exceeding February’s previous highest total of 63,258 by over 14,000 applications – an additional 22%!
At the fear of repeating ourselves, February was the first time ever that application submissions have surpassed 60,000 in a single month, a record that has already been smashed with over 77,000 submitted this month.
The graphs clearly show completely new trend lines this year that far exceed previous trends seen in March. In all but 2020, March is the busiest month following increases in January and February. With Easter falling in early April and therefore fewer working days in the month, we predict that we won’t experience a further increase this month but to what extent we see growth is impossible to predict.
The above article was provided to us by the Planning Portal.
Find out more about the MIR Report here.
